CITIZEN SCIENCE DATA
In order to understand complex ecological problems, you need large amounts of data that is consistently collected over a long period of time.
ORCA scientists and community members are working together to gather data needed to optimize conservation efforts.
Explore Pollution Mapping Data
Pollution Mapping Citizen Science Project
This project involves on-going comprehensive monitoring of specific sites within the Indian River Lagoon. During each quarterly monitoring event, citizen scientists measure basic water quality parameters (temperature, salinity, dissolved oxygen, pH, and alkalinity), measure muck depth, and collect both water and sediment samples to be brought back to the Center for Citizen Science for analyses. Once at the lab, citizen scientists composite and prepare samples for particle analysis, as well as measure nutrient concentrations (ammonia, nitrate/nitrite, and phosphate) in both water column and pore water samples. Additional analyses of these samples include relative toxicity, glyphosate, and atrazine.
110
CITIZEN SCIENTISTS
30
PROJECT SITES
The data below was collected between 2019 and 2024, and will be periodically updated. If you’d like to see additional data, please e-mail your request to mweiss@teamorca.org.


References: [1] Wani, A. L., Ara, A., & Usmani, J. A. (2015). Lead toxicity: A Review. Interdisciplinary Toxicology, 8(2), 55–64.; [2] Lee, J.-W., Choi, H., Hwang, U.-K., Kang, J.-C., Kang, Y. J., Kim, K. I., & Kim, J.-H. ; (2019). Toxic effects of lead exposure on bioaccumulation, oxidative stress, neurotoxicity, and immune responses in fish: A Review. Environmental Toxicology and Pharmacology, 68, 101–108; [3] Environmental Protection Agency. (n.d.). EPA. [4] Mercury contamination of aquatic environments. Mercury Contamination of Aquatic Environments | U.S. Geological Survey. (n.d.). [5] MacDonald, D. D. (1994). Approach to the Assessment of Sediment quality in Florida Coastal Waters. Development and Evaluation of Sediment Quality Assessment Guidelines, 1, 1–140; [6] Myers, J.P., Antoniou, M.N., Blumberg, B. et al. Concerns over use of glyphosate-based herbicides and risks associated with exposures: a consensus statement. Environ Health 15, 19 (2016); [7] Hand, J. (2004). Typical water quality values for Florida’s lakes, streams, and estuaries. Florida Department of Environmental Protection, 101; [8] Protecting Florida’s springs. Florida Department of Environmental Protection; [9] Florida Department of Environmental Protection PFAS Dynamic Plan; [10] EPA.gov
Explore Fish Monitoring Data
One Health Fish Monitoring Citizen Science Project
This project tests for toxins and toxicants in fish from the Indian River Lagoon and connecting waterways. Current analyses in this project include: heavy metals (mercury, lead, cadmium), cyanotoxins (microcystin and saxitoxin), microplastics, and per- and polyfluoroalkyl substances (PFAS). Additional analyses coming soon include: pharmaceuticals, controlled substances and parasites. This is an ongoing project, and the data presented will continue to be updated as additional samples are collected and analyzed.
270
CITIZEN SCIENTISTS
1500
FISH PROCESSED
CLICK HERE TO EXPLORE THE DATA
This data was collected between 2019 and 2025, and will be periodically updated. If you’d like to see additional data, please e-mail your request to fish@teamorca.org.
A Day in the Life of the Indian River Lagoon Data
A Day in the Life of the Indian River Lagoon Student Citizen Science Project
Each year, hundreds of students, teachers, and environmental partners collect scientific data at various sampling sites all along the Indian River Lagoon and the Lake Worth Lagoon on the same day in October. Student citizen scientists use hands-on field techniques to measure the same chemical, physical, and biological parameters to evaluate how their local piece of the estuary fits into the larger ecosystem.
Teachers are encouraged to integrate A Day in the Life data and information into school curriculum, science fair projects, and research opportunities throughout the school year. The results help students build a better understanding of the local ecosystem’s ecological health and the relationship their sites have to the entire watershed

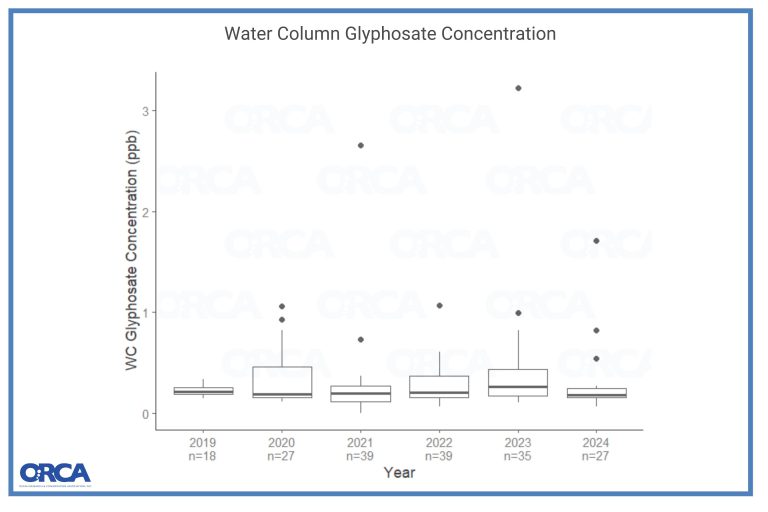
This figure shows water column glyphosate concentrations from A Day in the Life of the Indian River Lagoon (ADIL) Citizen Science project from 2019-2024. Teams of citizen science including students and teachers with the support of a local environmental partner, collected single water column samples from a specific site within the Indian River Lagoon (IRL) or its contributing waterways – all on a single day in October. These samples have been collected for six consecutive years. Glyphosate was measured in the water samples by ORCA scientists using a commercially-available ELISA (enzyme-linked immunosorbent assay) kit. This box and whisker plot shows the distribution of glyphosate concentration by year from 2019 to 2024. This plot shows year on the x-axis and the water column glyphosate concentration in parts per billion (ppb) on the y axis. This figure makes it evident that glyphosate is present across the IRL at low concentrations (mean: 0.305 +/- st dev: 0.357 ppb). There are many variables that could affect glyphosate concentration including application time and quantity, chemical composition of herbicide, wind direction, currents, rainfall, temperature, and more. There was no significant difference across years when running an ANOVA test on this data (p-value >0.05). Of the years sampled, 2020 and 2023 tend to have higher concentrations while 2021 and 2024 have typically lower concentrations. In conclusion, it appears glyphosate fluctuates slightly between years but there is no overall trend in glyphosate concentration levels observed in the IRL shown through this data.
Dive into Team ORCA’s Citizen Science blog to read about the importance of data collection, why we monitor, the significance of citizen science and more!
